GE SOFTWARE - POWER PLANT EXPERIENCE


Never before industrial machines that runs the world such as power plants, airplanes, locomotives, and oil & gas have had the limelight that they've deserve — to be on the internet is to be IOT (Internet of things). Just like Nest, your smart door lock, garage, and your dropcams, the rest of the world wants to join in the fun.
The goal for this project was to create & design a Software Application that GE would sell software as a service (SaaS) to their Power & Water clients. The application will have a clean and modern look and feel, following the latest User Experience methodologies.
The process was using Agile all through out the development stage. Slightly Waterwall within the design studio to properly research and design for the prototype without always including engineers on every concept we made. Eventually, the point where it was good enough for clients to poke around would come, would be the time to initiate real traction for real customers to be more engaged.
UX PROCESS:
1. Research. I worked on the research and gathered all of the necessary information in order to fully understand what Power Plants do and to help the rest of the UX team and business to better understand what we are up against.
2. Competitive and Landscape Analysis. Since there are no real actual competitions who have created softwares for Power Plants, we took other examples such as what other successful tech leaders are doing in the Enterprise space.
3. Gathering requirements through qualitative interviews, and crafting insights from observation from SME (Subject Matter Experts). In this case: An executive, Plant Manager, Stock Broker, and Plant employee. We had a 4 day workout session.
4. Created User Personas to the above SMEs.
5. User scenario flows: understand how each Persona will use this tool and for what purpose
6. Wireframes using omnigraffle and axure
7. Visual Design: mock ups and iconography study based off of GEs IIDX Design System that is used all across the board.
8. Clickable Prototype using Axure (world's largest Axure).
9. User test using limited Clickable Prototype. Went back to the SMEs and had them user test it 3x. I also went to other individuals who are not in the industry and individually asked for feedback.
10. Dev build with 25 engineers who focused on specific core of the engineering: Back-end, front-end, and data visualization.
Below are images from a 2 day workout we had with the Subject Matter Expertise (SMEs) as GE employees. They provided the knowledge we needed to understand the requirements of what we should be building for the users of this application. At the end of it all, it was evident that they wanted efficiency. If they become efficient by only even 1-2%, the savings will be in the billions.
The key result we got from the Workouts was that we were able to narrow down key personas/individuals that will most likely use the software: Executive, Plant Manager, and Regional Manager.


As the Lead UX Visual Designer, my role was to be part of the process from end to end to understand what and who we are designing for. We helped the team educate the Subject Matter Expertise (SMEs), engineers by trade. We helped them understand how significant design is to the entire process — that it will be painful and it's not just an overnight thing. Eventually during the process they found a huge value in design and had more appreciation with UX. We worked side by side with the developers making sure that the designs are properly executed.
The visual design is based off of a design system GE Software already has developed called IIDx. It's the same style used all across their software to control the GE Brand. It also minimizes the inconsistencies across the division. Then it is plugged into their Operating System called PREDIX.
I was also part of the User Testing. We had 3 sessions of User Testing at different times, each with about 5 Personas for 1 hour each. We asked questions and took notes of their Insight and made design adjustments according to what we found that needs improvement. After the design adjustments, we scheduled another session and do it again.
Initial Screens with IIDX design system applied
This view was created and sketched to show the Executive Dashboard view so he/she can quickly make decisions based off of the key metrics below.

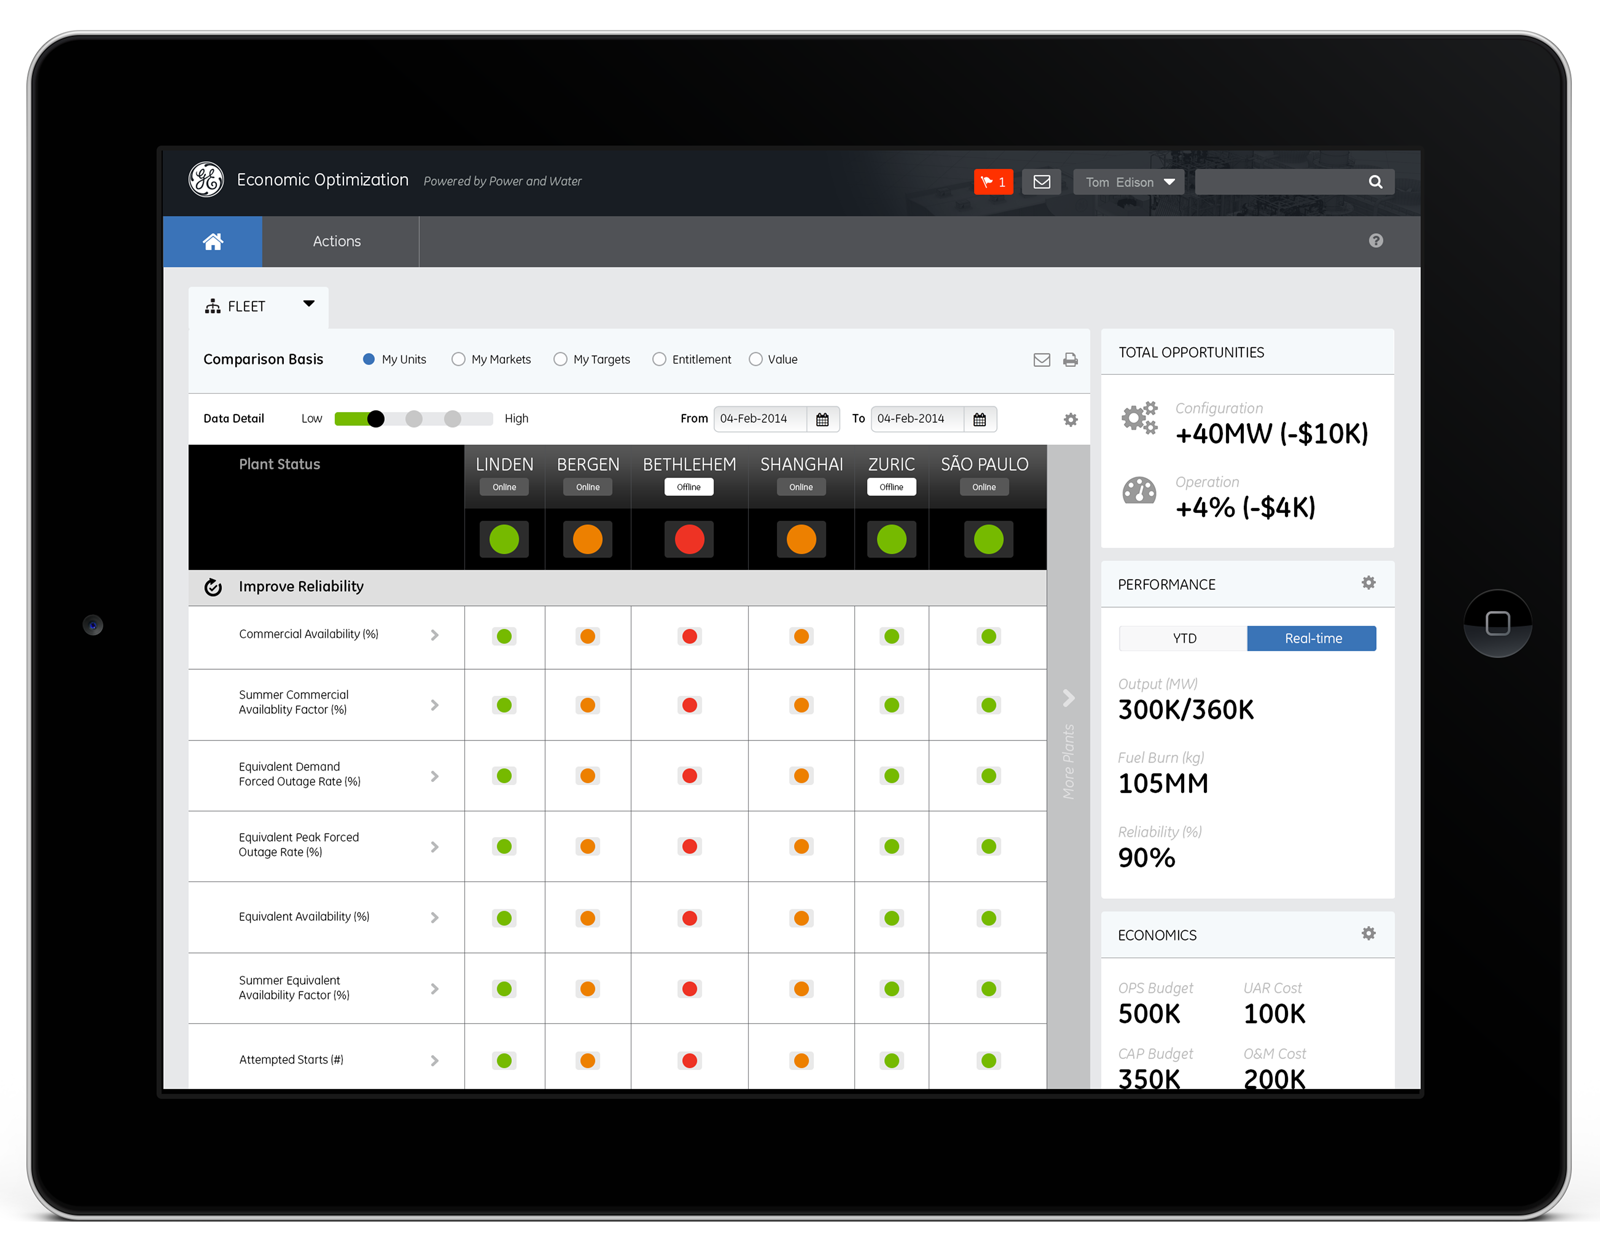
Next set of design layout with changes based from the above screens. They want to visualize and organize the portfolio better. This view is a deeper set of information, more catered towards the Plant Manager.

Expanded view of an opened KPI displaying data Visualization and Key metrics. You can also drill further down within each charts.


GE Software Power & Water
Project: Economic Optimization
Role: Lead UX Visual Designer
In collaboration with: Siyu Chen, Melody Ivory, Michael Arent, Beatriz Montiero, Leo Schnieder, Henning Fischer.